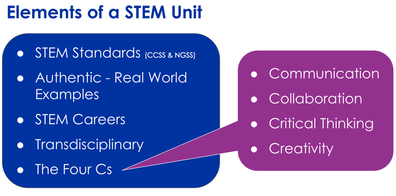
This year we are welcoming a new STEM school to the district, William H. Brown Elementary School. When planning for their introductory professional development, as a team we knew that we wanted to have the teachers participate in a high-quality STEM activity that incorporated the five elements of a STEM unit: STEM standards, authentic (real world examples), STEM careers, transdisciplinary, and the Four Cs).
My colleague, Chris Nho (email, twitter) had the brilliant idea to have the teachers participate in an activity inspired by Dear Data. Dear Data was a year-long project by Giorgia Lupi and Stefanie Posavec, two award-winning information designers. Once a week the designers sent each other personal data in the form of hand drawn postcards and through these messages, they learned more about one another. You can watch a short video about the project here.
My colleague, Chris Nho (email, twitter) had the brilliant idea to have the teachers participate in an activity inspired by Dear Data. Dear Data was a year-long project by Giorgia Lupi and Stefanie Posavec, two award-winning information designers. Once a week the designers sent each other personal data in the form of hand drawn postcards and through these messages, they learned more about one another. You can watch a short video about the project here.